
If you've been around the automated trading world for a while, you've probably seen countless Expert Advisors advertised with eye-catching backtests and impressive profit curves but not the exact verified EA analytics
The problem?
A screenshot can show anything.
Many traders end up buying EAs based on carefully selected results, only to discover that the strategy performs very differently in live market conditions. A great-looking backtest is useful, but it only tells part of the story. What really matters is how a strategy performs today, on a real broker, with real market conditions.
That's exactly why we built the TradingBotLab Lab.
Instead of relying on marketing claims or selective screenshots, the Lab gives traders access to detailed analytics, combined portfolio testing, and live performance tracking. The goal is simple: help you make decisions based on data rather than assumptions.
Here's how the Lab works and how you can use it to get verified EA analytics to evaluate your portfolio before risking your capital.
1. Explore the Backtest Engine
When you enter the Lab, you'll find a list of available trading bots in the sidebar, including strategies such as Dark Nova, Dark Venus, and other supported EAs.
Selecting an EA opens its dedicated analytics dashboard, which is divided into two main sections:
o Back test Results
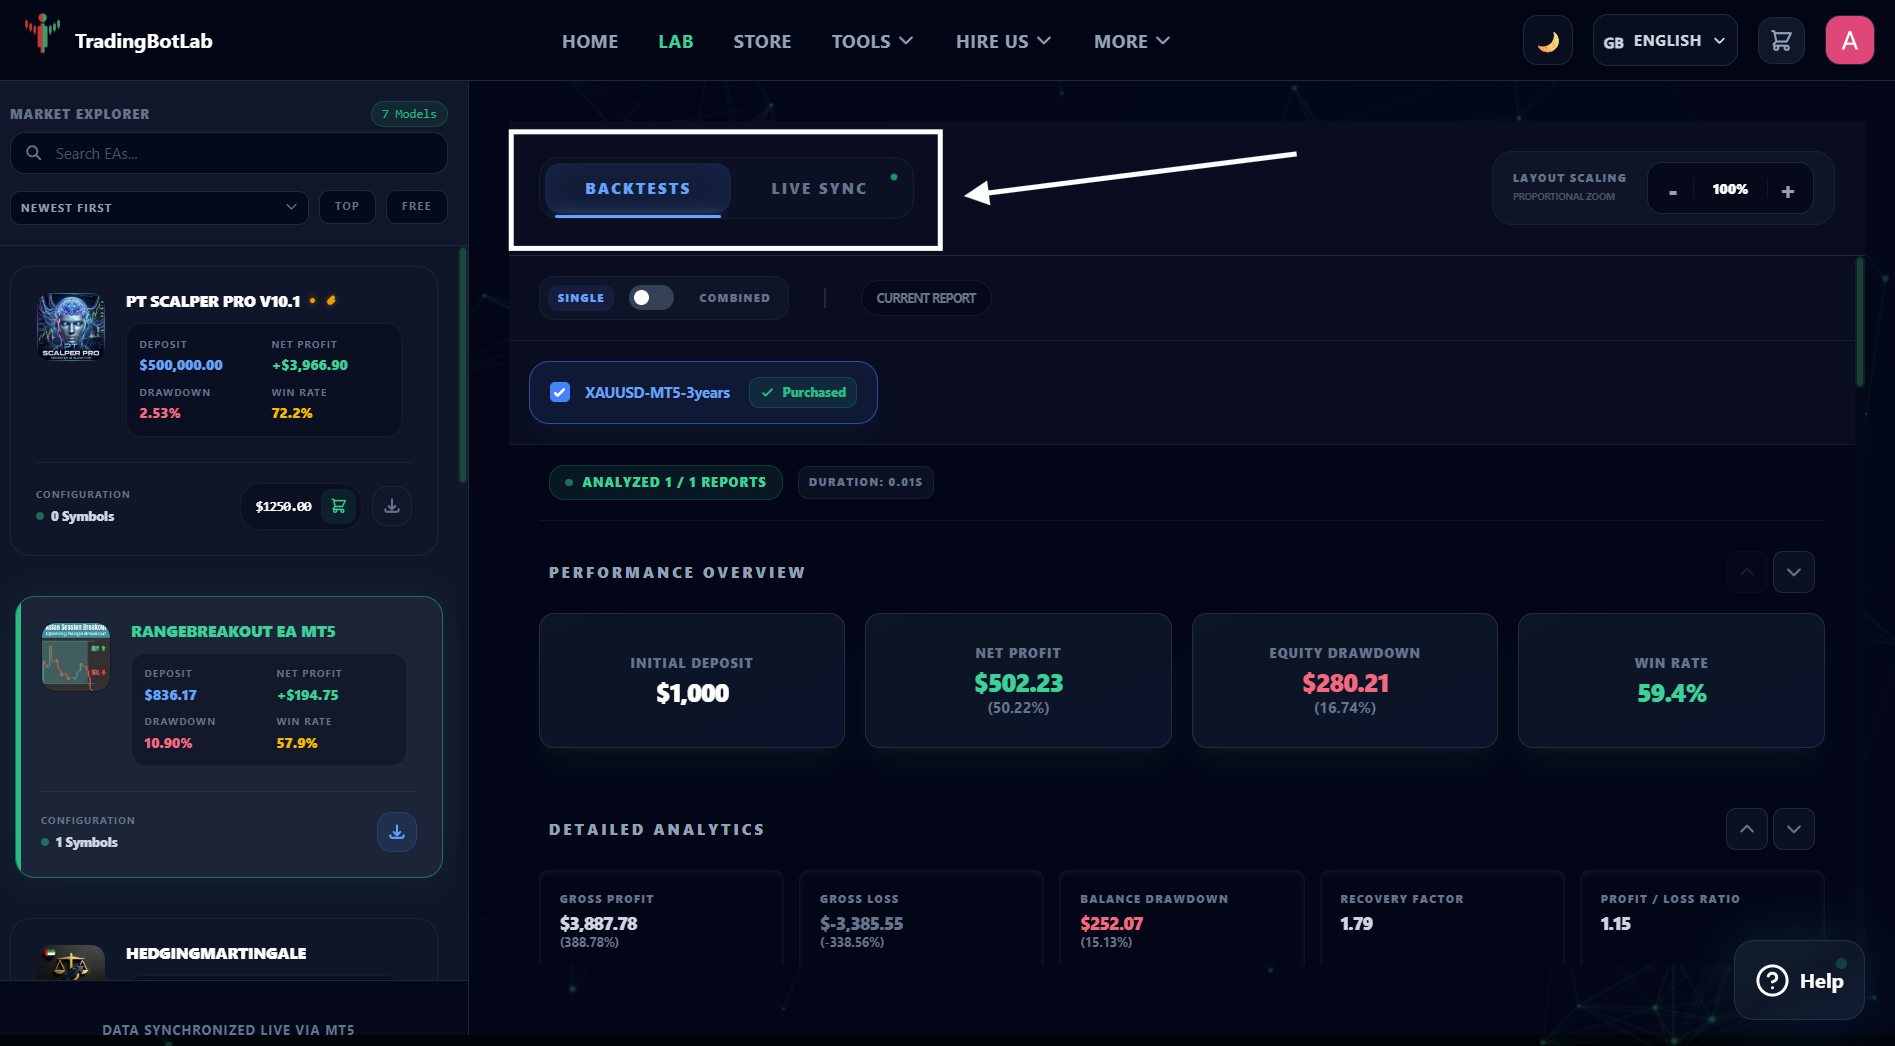
The Backtest Results section is where you'll find one of the most useful features available to traders: the ability to switch between Single and Combined views.
Single View
Single View focuses on one specific strategy configuration.
Here, you can analyze:
o Historical performance
o Win rate
o Profitability
o Drawdown
o Equity growth
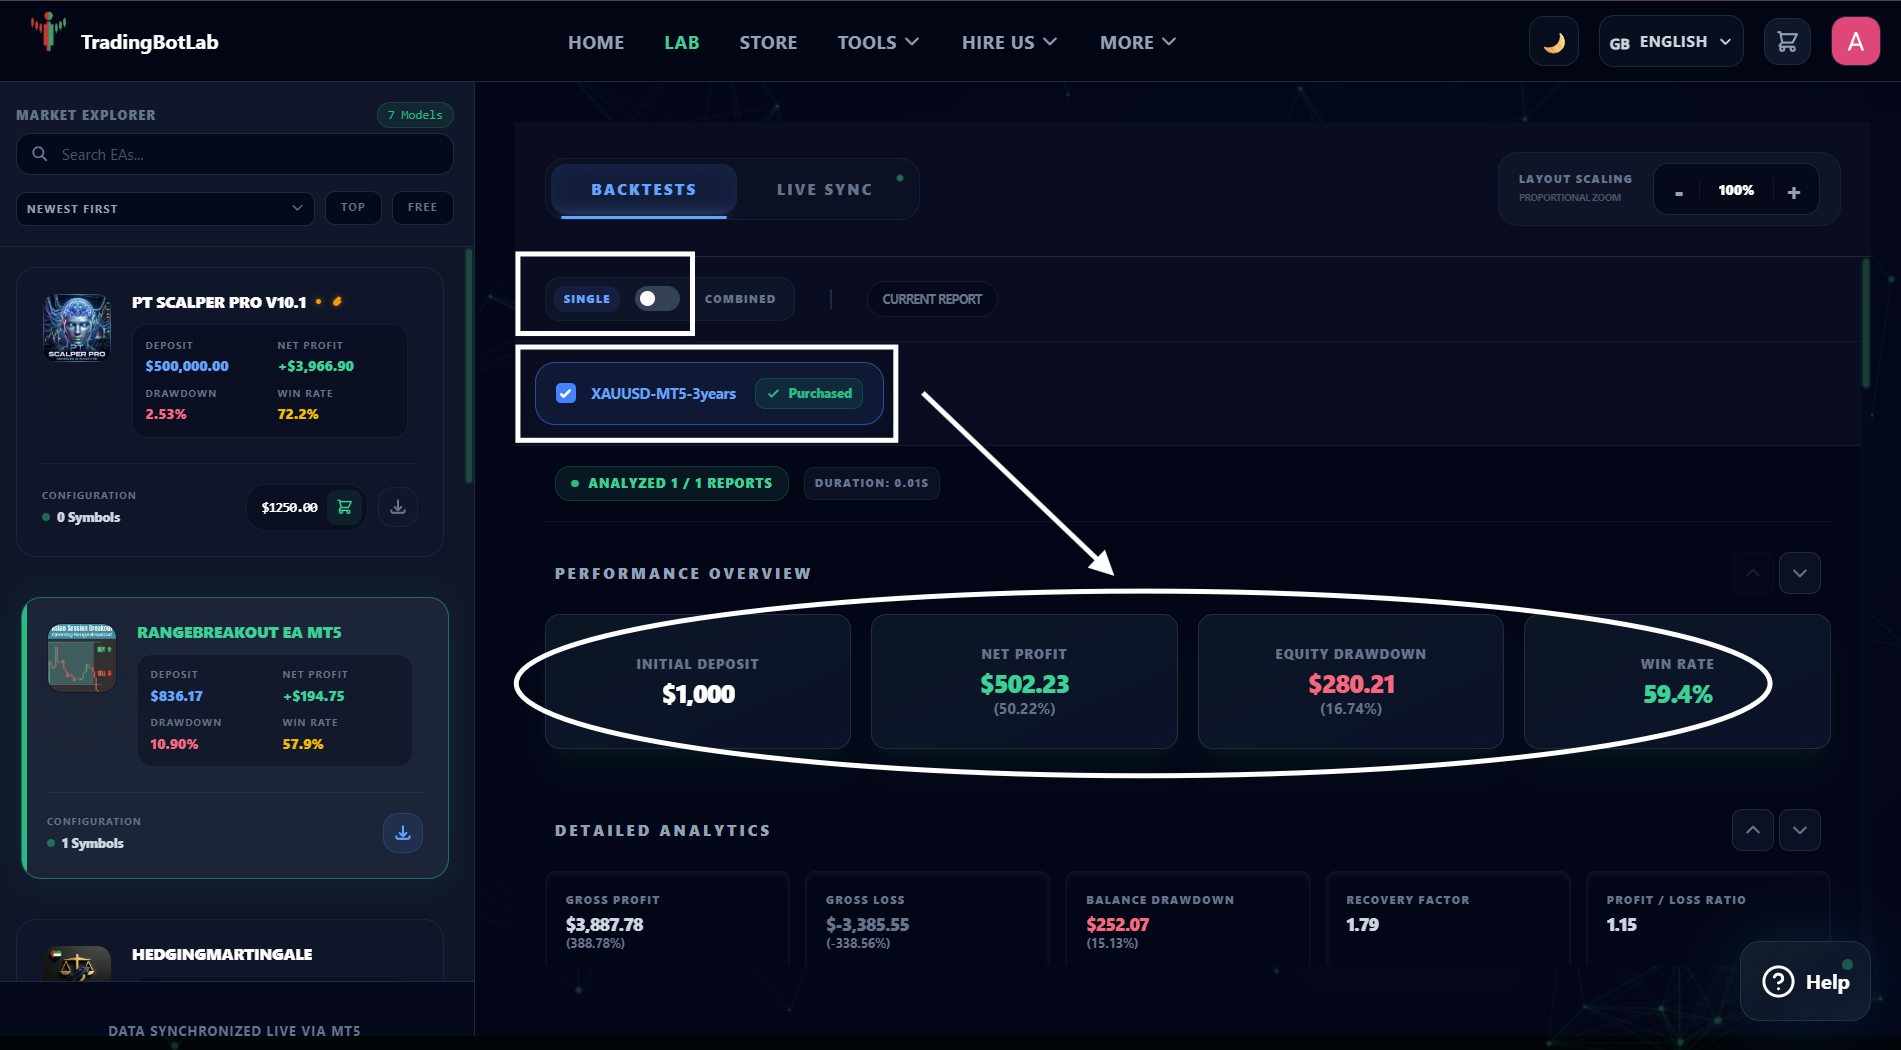
This is useful when you want to understand how a particular .set file has performed on a specific currency pair.
Combined View
Most traders don't run just one strategy.
You might be trading EURUSD, GBPUSD, and Gold at the same time on the same account. Looking at each backtest separately doesn't tell you how those strategies interact together.
That's where Combined View becomes valuable.
Instead of displaying individual results, the system combines selected strategies into a single portfolio simulation.
This allows you to see:
o Combined equity growth
o Portfolio-level drawdown
o Overall win rate
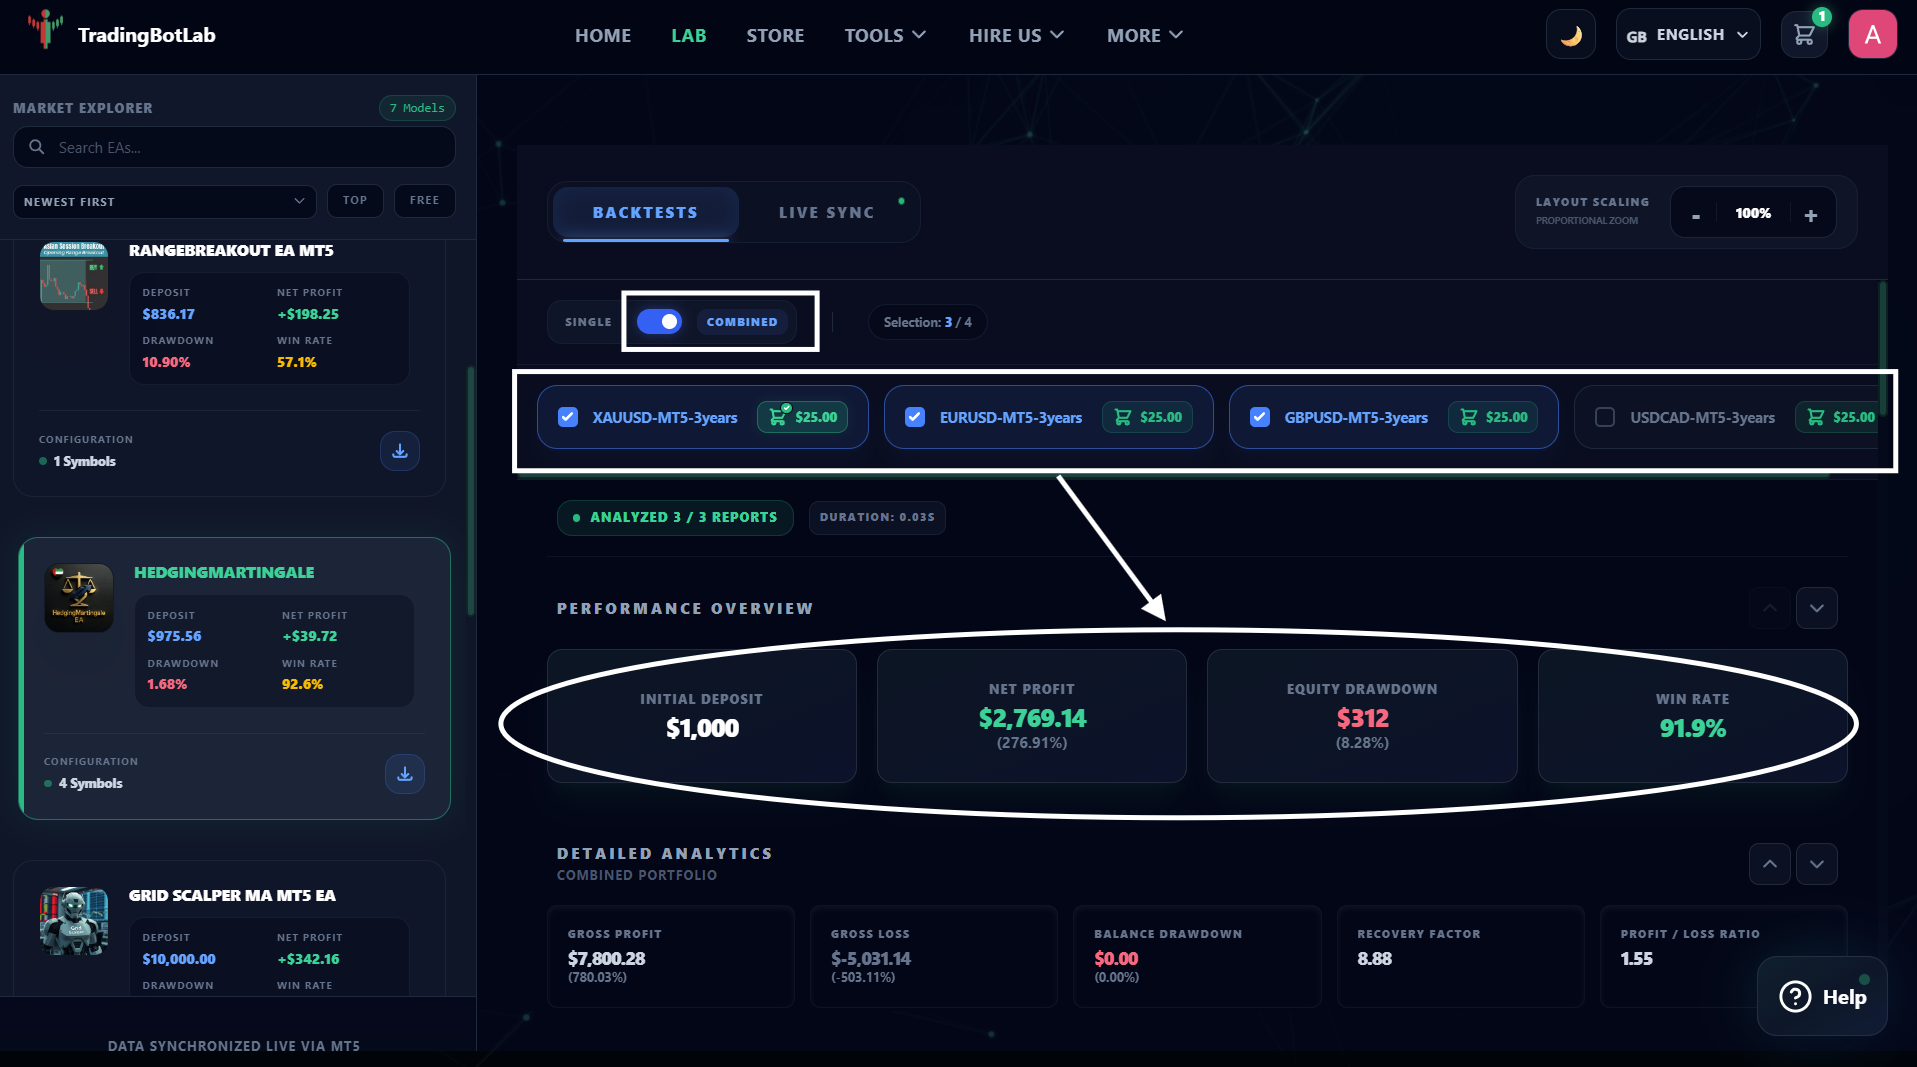
In other words, it provides a more realistic picture of what could happen if those strategies were operating together on one account.
Dive Deeper into the Data
Beyond the summary statistics, you can also explore detailed visual reports that break performance down by:
o Month
o Week
o Trading hour
o Holding time
o Profit and loss distribution
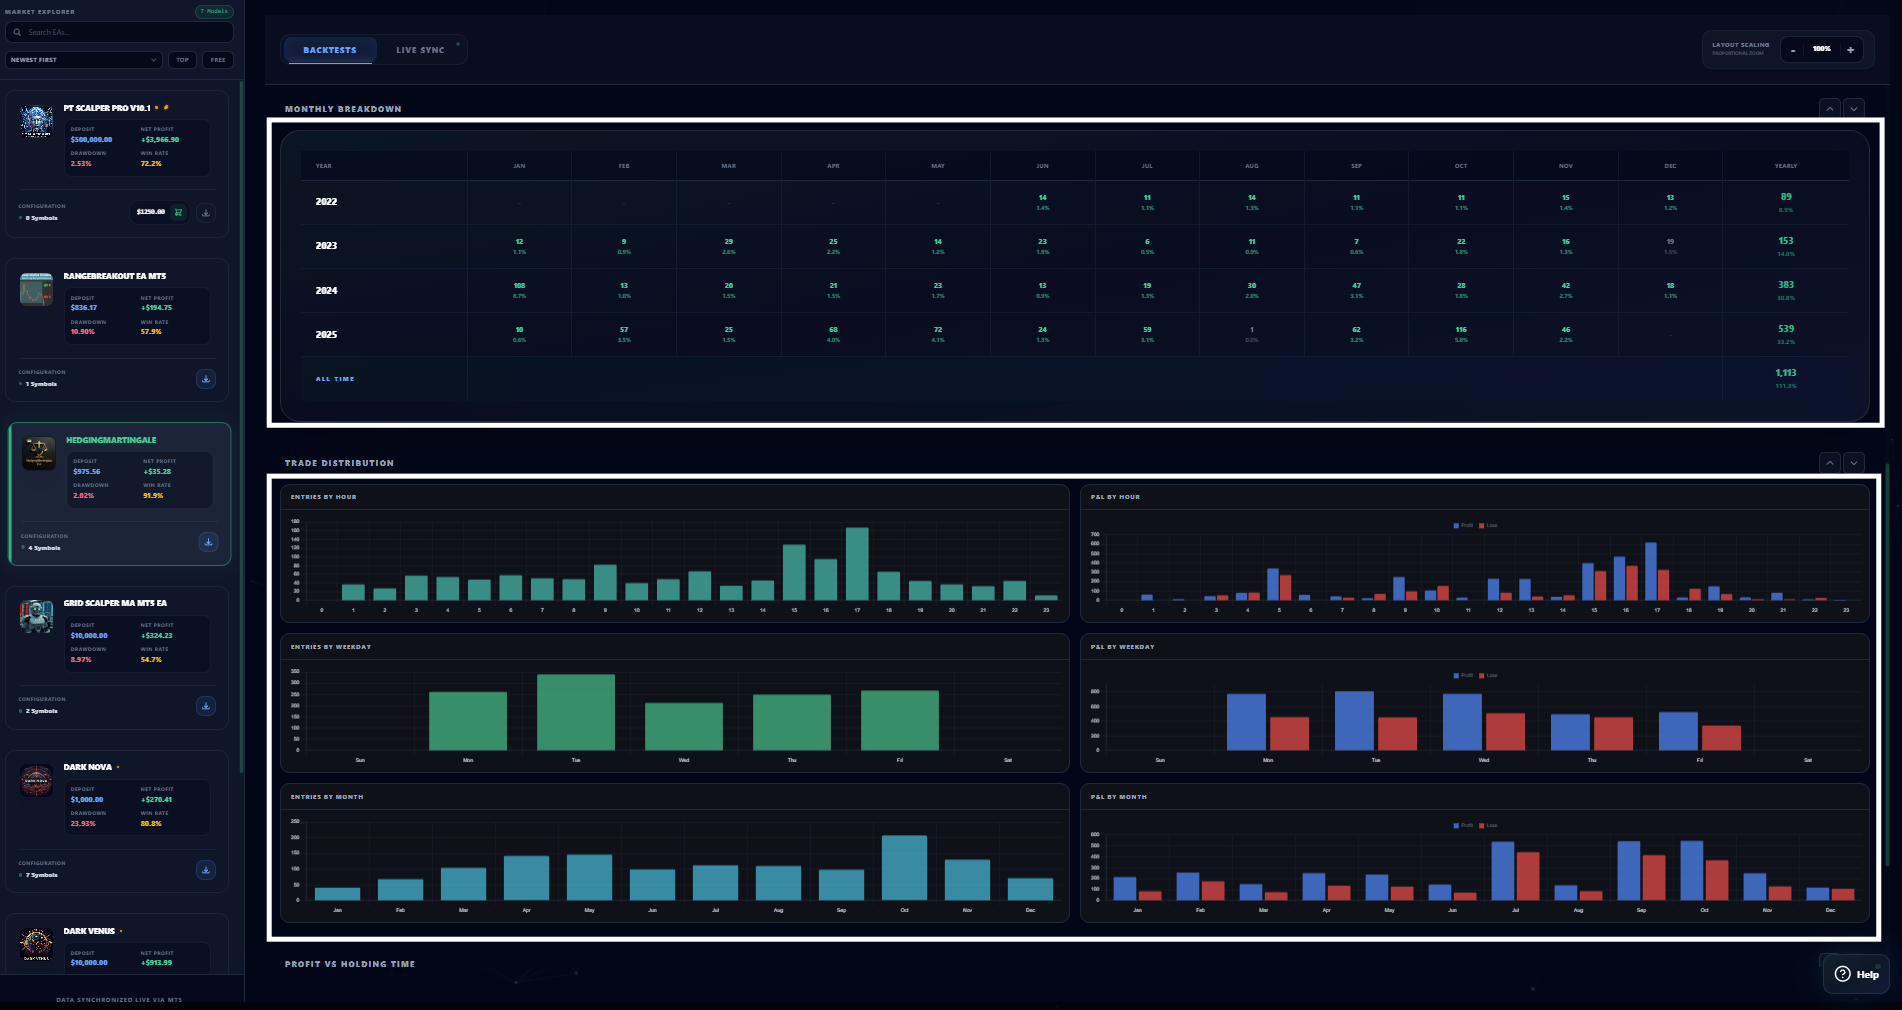
These insights can help you better understand when a strategy performs best and where potential weaknesses may exist.
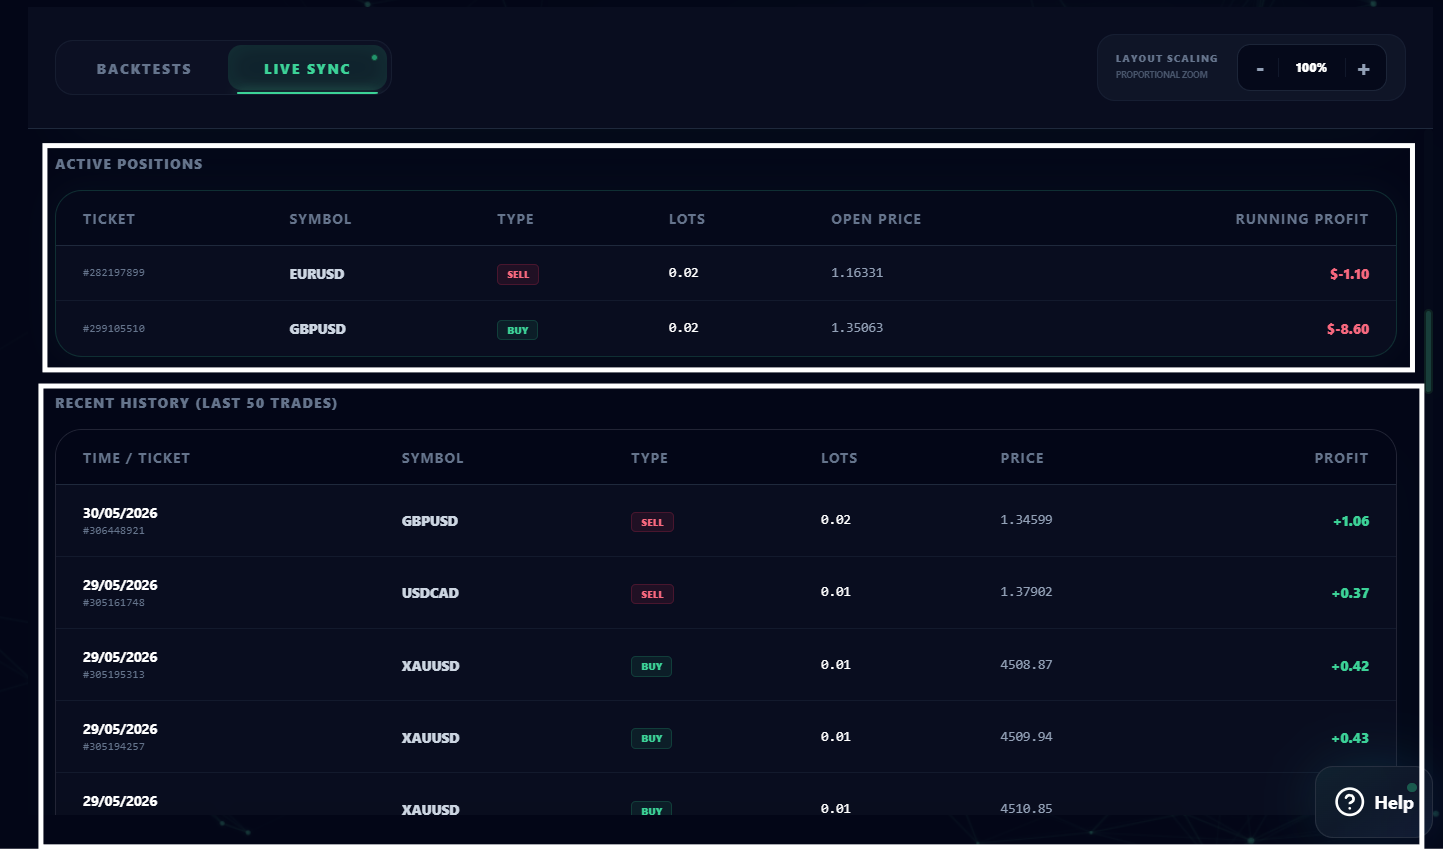
2. Live Sync: See What Is Happening Right Now
Backtests show what happened in the past.
Live Sync shows what is happening today.
This section removes the guesswork by displaying the current performance of the strategy in live market conditions.
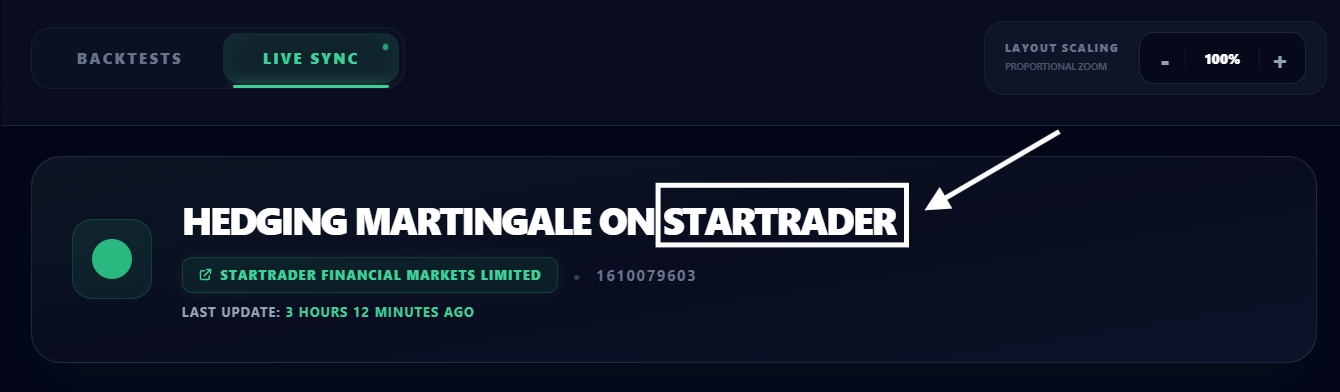
Verified Broker Environment:
You can see exactly where the strategy is running, including the broker being used for testing.
This provides additional transparency and allows traders to evaluate results within a real trading environment.
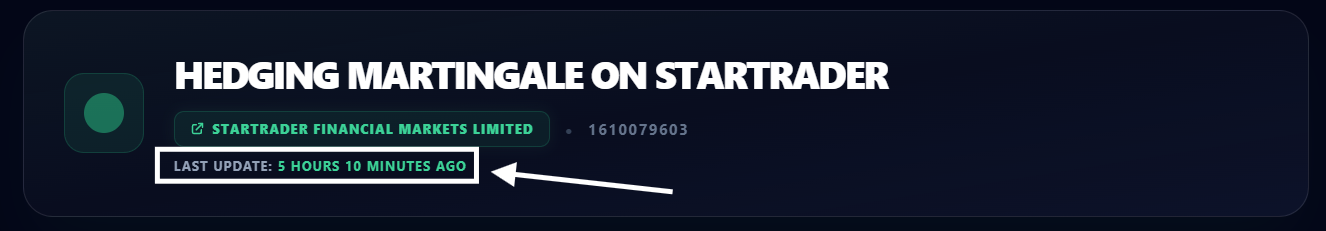
Real-Time Performance Updates:
The dashboard continuously updates with fresh account data and displays the most recent synchronization time.
This means you're not looking at outdated reports or months-old screenshots.
Monitor Key Metrics
The Live Sync dashboard allows you to track important statistics such as:
o Net profit
o Monthly growth
o Win rate
o Profit factor
o Account performance
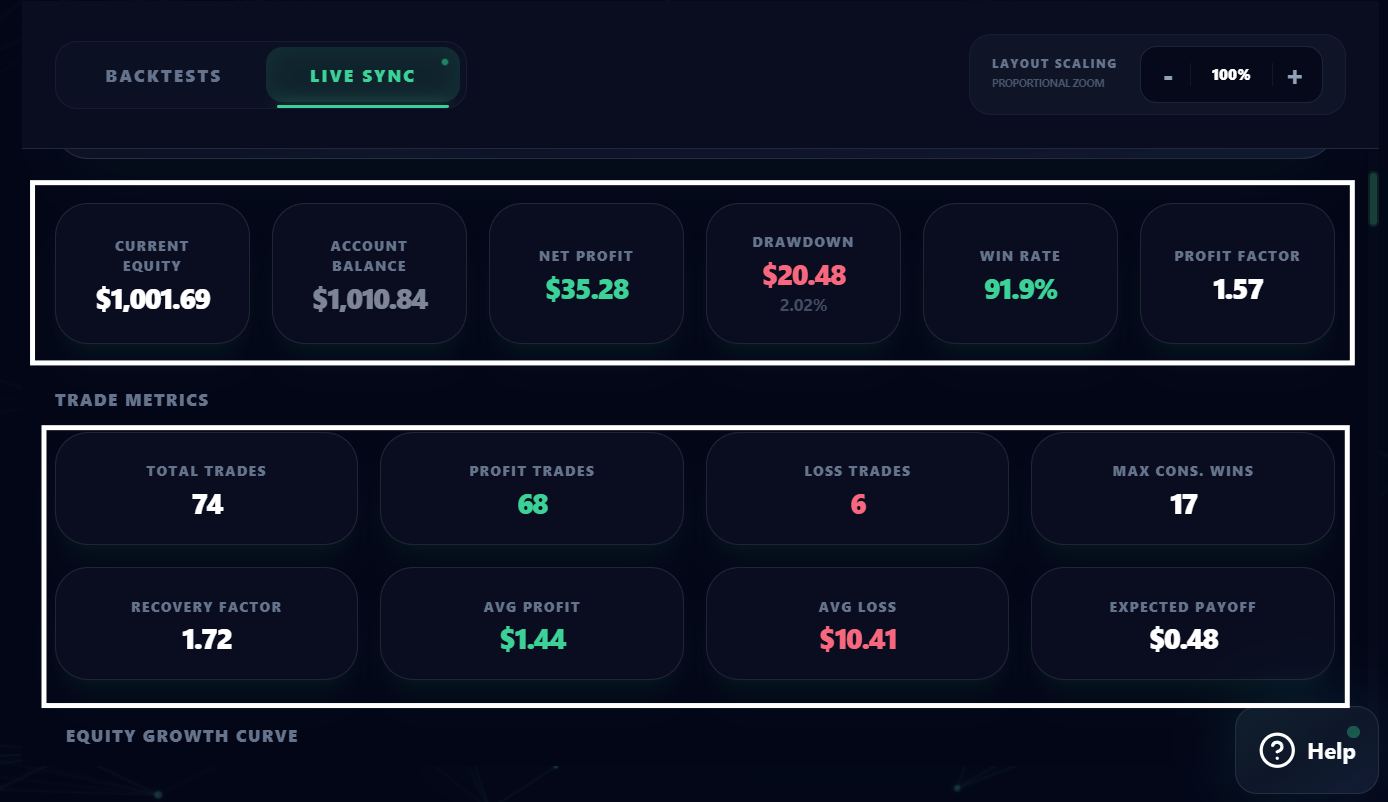
Everything is based on actual trading activity rather than simulated results.
Complete Trade Transparency:
You can also review:
o Current open positions
o Entry prices
o Lot sizes
o Closed trade history
If a strategy is performing well, you'll see it.
If it's struggling under current market conditions, you'll see that too.
The goal is transparency, not marketing hype.
3. Purchase the Exact .Set Files You Analyzed
Once you've reviewed the backtests and verified the live performance, you can purchase the exact .set files directly from the platform.
This means there is no confusion about which configuration was tested.
The same settings you've analyzed are the settings you'll receive.
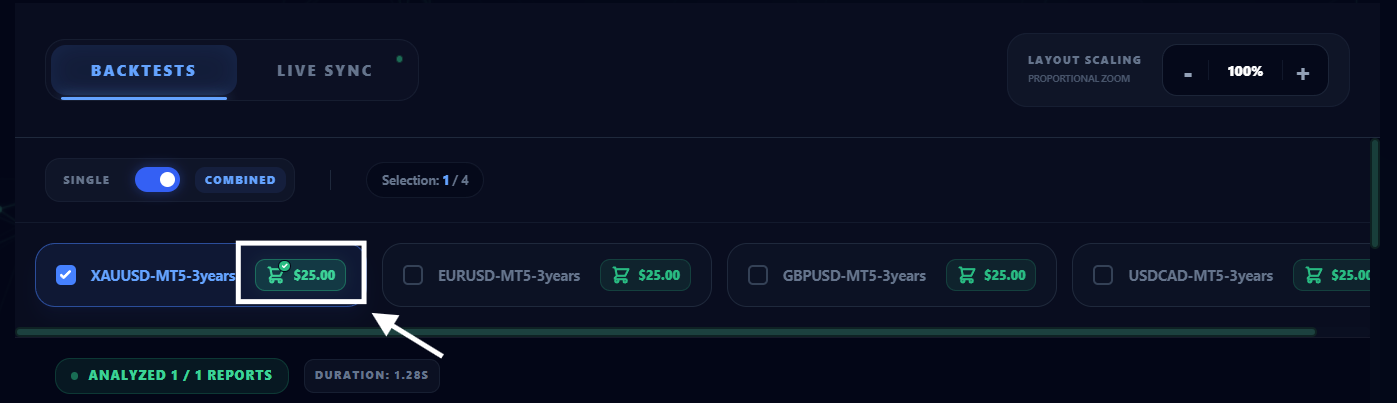
Build Your Portfolio
Add the configurations you want to run and create a portfolio that matches your trading goals.
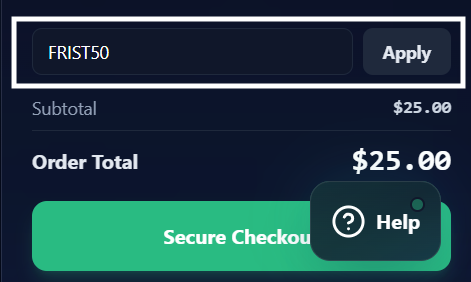
Apply Available Discounts
If promotional offers are active, you can apply the relevant coupon code during checkout.
For example, early users may have access to promotions such as FIRST50, which offered a 50% discount to a limited number of customers.
Secure Checkout with Binance Pay
The checkout process is powered by Binance Pay for fast and secure payments.
Simply:
o Select Binance Pay.
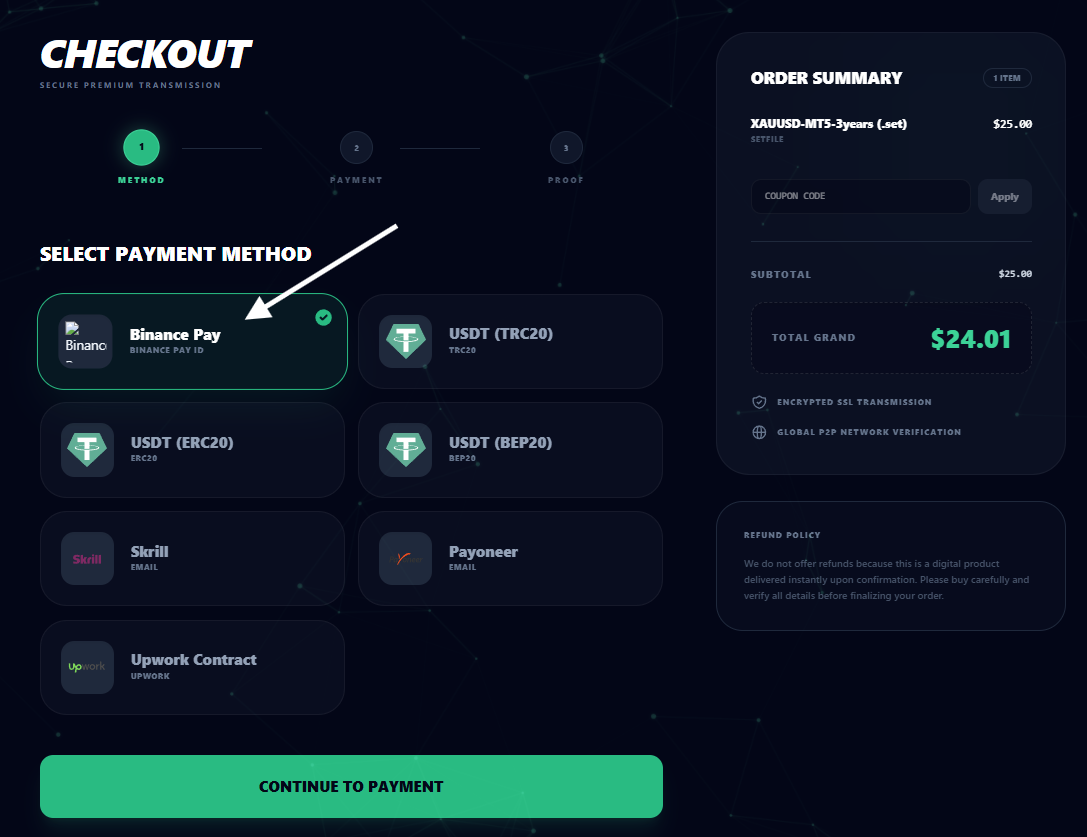
o Scan the generated QR code.
o Send the exact payment amount shown.
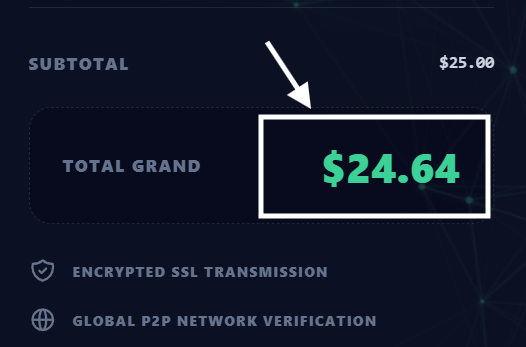
o Confirm your transaction.
Because the system uses the exact payment amount for automatic verification, accuracy is important when completing the transfer.
Download Instantly
After your payment is confirmed, your purchased files become available immediately inside:
Account Profile → My Purchases
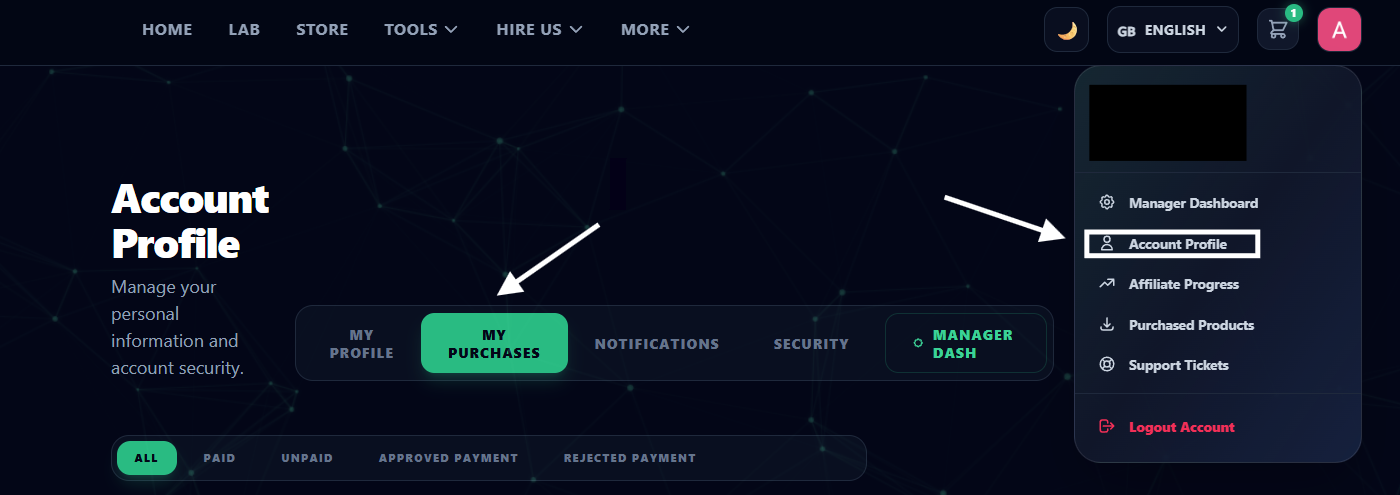
From there, you can download and deploy your optimized .set files whenever you need them.
Verify Before You Deploy
Successful trading starts with reliable data.
Rather than relying on marketing screenshots or bold performance claims, use the TradingBotLab Lab to examine both historical results and live trading performance before making a decision.
Analyze the backtests, review the combined portfolio data, monitor the Live Sync results, and make your choices based on transparent information.
Because when real money is on the line, verified data matters far more than impressive screenshots.